


What are daily settlement futures?
A daily cash settled futures contract based on the daily assessment price for the Gulf Coast ULSD in the Colonial Pipeline. A paper contract that mirrors the cash MOC ULSD 62-grade Colonial Pipeline at Pasadena, Texas. Each trading day has a Daily Settlement price as opposed to an average over several days like either the Calendar Month Average (CME LT) or Balmo (CME 1L) contracts. Currently, listed futures contracts expire on a single day of the month, without the choice of every day of the week. With a Daily Settlement futures, traders can precisely hedge the timing of their waterborne laycan windows or pipeline cycles.
The red line is the Daily Settlement price curve. Below shows the steps to create a “Mark-to-Market” Curve, as opposed to a “Trading” Curve. A Trading Curve must reflect accuracy for each point along the curve, and be ready to execute those theoretical prices in the market. For a Market-to-Market curve to work well, it has to be easy to understand and re-create. We are less concerned with the granular prices for each day. The goal is to create theoretical values that move with the prompt cycle as well as the paper derivatives. The Daily Settlement should avoid imperfect hedging also known as Basis Risk. Basis Risk means that a futures contract used for hedging may not perfectly offset the price movements of the underlying asset, potentially leading to unexpected gains or losses.
Bootstrapping Method
The name "Bootstrapping" describes one specific method to construct a curve from a given set of instruments. Bootstrapping works by sequentially solving values on the curve.
Define the Instruments whose prices will instruct the curve.
For the purpose of constructing a GC ULSD curve, we will use:
1) Prompt cycle price for 62-grade Colonial Pipeline at Pasadena. Add more cycles for better granularity. The differential of the prompt cycle EFP to the reference NYH ULSD Futures forms the basis cash price.
2) Gulf Coast ULSD Up-Down BALMO
3) Gulf Coast ULSD Up-Down Monthly Contracts
Define the structure of the curve which will be solved to suit those instrument prices.
We want a basic ‘bootstrap’ curve. The default structure is to enter prices for ‘nodes’ or Date/Price pairs along the maturity of each contract. We then use a simple linear interpolation to connect the nodes.
Nodes & Prices
Node 1: (Current Trade Date; Prompt Cycle 62-Grade MOC. Basis to NYH HO contract)
Node 2: (Mid-month date between Node 1 and end of current month; BALMO Up-Down)
Nodes 3-5: (Mid-month for next prompt month. The 15th of the month will be used; Cal Month Average price for the GC ULSD Monthly Contract)
Example
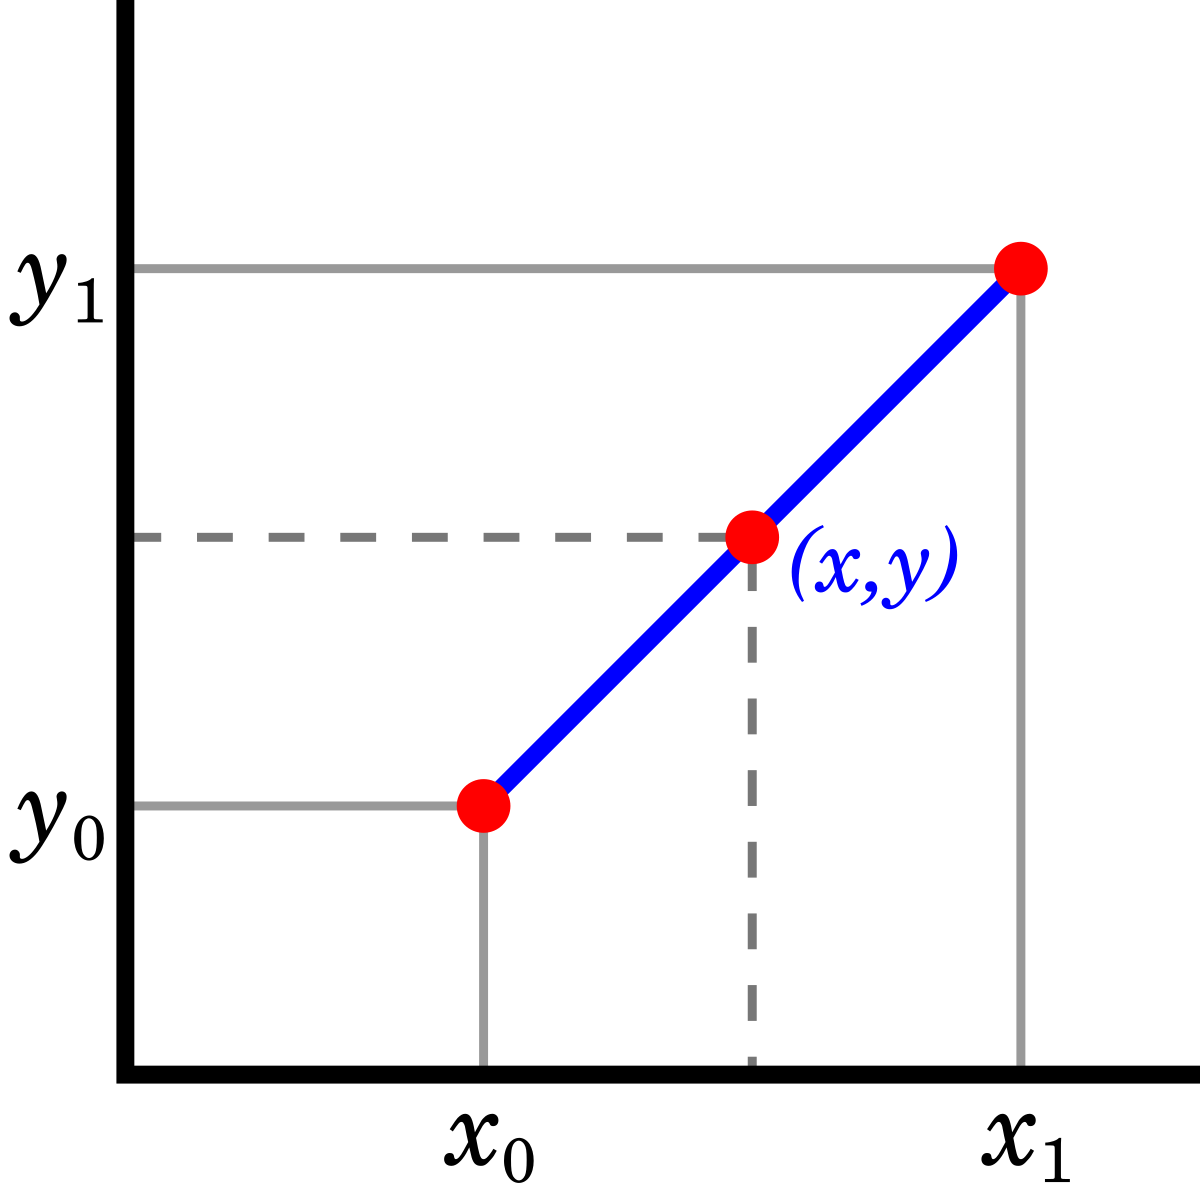
Consider a graph with the Nodes X-axis as the Date and the Y-axis as the Price.
(X, Y) = Node(Date, Price)
Today’s Trade Date is Aug 10th. The prompt Colonial Pipeline Cycle settled $2.10/gallon. BALMO August calendar swap settled $2.00/gallon. And Calendar September swap is worth $1.85 and Calendar October is worth $1.60.
Node 1: (Current trade date; 2.10)
Node 2: (Aug 20th; 2.00)
Node 3: (Sep 15th; 1.85)
Node 4: (Oct 15th; 1.60)
Linearly connect the nodes to create the Daily Settlement Prices. Use the difference in the number of days between nodes to create the daily time increment. Divide prices between nodes by the time increment to graph straight lines between Node(Date, Price) pairs.
Linear Interpolation
DISCLAIMER
Hydrocarbon Reports materials, information, and presentations are for educational purposes only and should not be considered specific investment advice nor recommendations. Futures, foreign currency and options trading contains substantial risk and is not for every investor. An investor could potentially lose all or more than the initial investment. Risk capital is money that can be lost without jeopardizing one's financial security or lifestyle. Only risk capital should be used for trading and only those with sufficient risk capital should consider trading.